The two years of the pandemic have generally been good for traffic volumes that were far below average for most of the two years. As people begin to go back to offices, those numbers will undoubtedly continue to rise.
However, even with the significantly lower traffic volumes of the past two years, traffic accidents of all kinds and traffic fatalities have seen almost inconceivable increases.
Thus, for example, the first six months of 2021 saw more than 20,000 people killed in motor vehicle accidents in the United States
, an 18.4 percent increase over the same period for 2020. Further disheartening news for road safety is that the National Highway Traffic Safety Administration (NHTSA) also found that speeding and failing to use seatbelts increased from March 2020 to June 2021.
Individual states and cities also saw increases in total accidents and traffic fatalities over the years of the pandemic. For example, New York City traffic dropped by a full two-thirds in the peak of the business shutdowns. Currently, NYC neighborhoods are back to about 80 to 90 percent of pre-pandemic traffic volumes. Long Island’s roads saw a decrease of about 50 percent and are now back to nearly 85 percent of pre-pandemic levels.
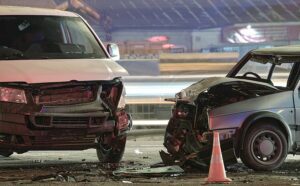
Nonetheless, just as with the country as a whole, New York’s accidents have not seen a corresponding drop.
Motor Vehicle Fatalities in New York, 2013-2022
For a free legal consultation, call 516-451-7900
Stats by States
Insurance companies and trucking organizations, for example, keep statistics to help them calculate each state’s insurance rates. Using their data calculators, you can look at the country, at one state, or a series of states.Complete a Free Case Evaluation form now
Property versus Injury versus Fatality
The Insurance Institute for Highway Safety (IIHS) publishes fatality statistics. It breaks down highway deaths by:Fatalities
Total crashes
Deaths by road user- Car Occupants
- Pickup and SUV Occupant
- Large Truck Occupants
- Motorcyclists
- Pedestrians
- Bicyclists
- Single Vehicle
- Multi-Vehicle
- Restrained Fatalities
- Unrestrained Fatalities
- Unknown Restraint Status Fatalities
- 0-4
- 5-14
- 15-24
- 24-44
- 45-64
- 65-74
- 75+
Property Damage
Statisticians record accidents with only property damage, accidents with property damage and injuries, and accidents with property damage and fatalities.Injuries
The National Safety Council, among others, publishes statistics about injuries and deaths in car accidents, noting that 2019 experienced 173,040 preventable car accident deaths, while 2020 saw 200,955, a fairly large increase of just over 16 percent. The NSC also records that nonfatal car accident deaths increased by nearly 16 percent from 2019 to 2020.Conditions at the Scene
Time of Day
Except for Sundays, most accidents tend to occur in the evening or late-night hours. Sunday accidents occur heavily between midnight and 4 a.m., presumably reflecting that this period falls within Saturday night for many.Day of the Week
Friday, Saturday, and Sunday tend to be the biggest days for accidents, with the highest numbers occurring in the transition from Saturday night to very early Sunday morning.Weather Conditions
Weather-related car crashes in the United States kill well over 5,000 people annually, accounting for about 16 percent of all motor vehicle deaths. Nearly half a million suffered injuries in weather-related accidents during the same period. The weather conditions for which statistics are maintained include flooding, lightning, tornados, hurricanes, and heat. Bad weather can lead to sudden severe reductions in visibility, posing a grave danger since drivers can’t see one another. Icy conditions, especially the hard-to-see “black ice,” create treacherous driving conditions.Causes of the Accident
#1. Distracted Driving
Distractions abound in the modern car. Even amid continuing reduced driving during the pandemic, a pedestrian dies every two hours and suffers injuries every seven minutes in the United States due to distracted driving, according to Together for Safer Roads. Most drivers think it’s all right to glance at a screen for up to two seconds, forgetting that, at 55 mph, a car will travel the length of a football field in that time. Most drivers today have one or more of the following in their vehicles:- GPS or other navigation systems
- Hands-free or handheld phone used for talk or text
- Food
- Makeup
- Tablet or computer
- Tray on the steering wheel for using any of the above
- Entertainment systems
- Passengers
#2. Speeding
Distracted isn’t the only problem; as the PSA always said, speed kills. According to the NHTSA, speeding is a factor in one in four highway deaths every year. Unfortunately, however, there’s not much agreement on what speeding is. So, let’s look at when the posted speed limit applies:- In daylight, with good weather above freezing and below 90 degrees, not too sunny with a clean road surface.
- In light traffic with good road visibility
- For an average-sized passenger vehicle, not an SUV, pickup, van, or semi-truck because they’re all harder to control and take longer to stop
- With drivers of sufficient skill for the road and the speed, as some drivers cannot control their vehicles at higher speeds.