Every time we get behind the wheel we enter a complex ecosystem of traffic. From the dense, gridlocked avenues of Manhattan to the high-speed stretches of the Long Island Expressway, the risks are as varied as the roads themselves.
At Rosenberg & Gluck, LLP, we believe that understanding the data behind these accidents is the first step toward prevention. Statistics represent lives altered, families impacted, and the urgent need for safer roads.
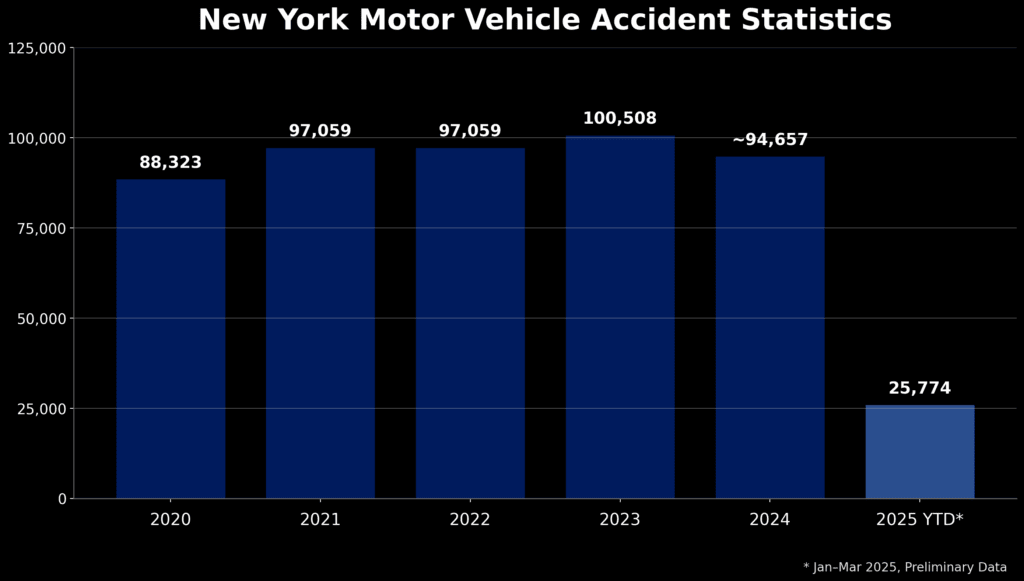
We break down the most recent motor vehicle accident statistics for New York State, New York City, and Long Island, offering a clear picture of the current environment for safety and what you can do to protect yourself.
Key Takeaways: New York Accident Trends at a Glance
- Accident Volume Remains High: Despite safety initiatives, New York City recorded over 38,000 crashes and 259 fatalities in 2023, with numbers remaining steady into 2024.
- Cyclists are at Risk: While pedestrian deaths have seen long-term improvement, cyclist fatalities have reached their highest point in the Vision Zero era, largely due to the increase in e-bikes.
- Location Dictates Danger: The risks vary by region, NYC accidents are defined by congestion and intersection conflicts, while Long Island accidents are characterized by high speeds and severe impacts on parkways.
- Top Cause of Crashes: Distracted driving remains the number one contributing factor to accidents across the state, followed closely by speeding and failure to yield.
- The "No-Fault" Reality: Because New York is a No-Fault insurance state, injured victims must prove they have sustained a "Serious Injury" to step outside the insurance system and sue for pain and suffering.
Call us today at (631) 451-7900 for your free consultation.
New York State Accident Trends
In recent years, New York has seen fluctuating trends in traffic safety. While initiatives like "Vision Zero" in NYC have aimed to eliminate traffic fatalities, the post-pandemic era has brought new challenges.
According to preliminary data from the National Highway Traffic Safety Administration (NHTSA) and local agencies, while there has been a slight national decrease in fatalities in late 2023 and early 2024, the numbers in New York remain concerningly high relative to pre-pandemic levels.
2023-2024 Key Findings
- Total Crashes: In 2023 alone, New York City recorded over 38,105 reported motor vehicle collisions. This number, while a slight decrease from the previous year, indicates that over 100 crashes still occur every single day in the five boroughs.
- Fatalities: New York City saw 259 total traffic deaths in 2023. This included 104 pedestrians, 126 motorists, and a concerning spike in cyclist fatalities, reaching 29, the highest number since the Vision Zero initiative began.
- Injuries: Thousands of New Yorkers are injured annually. In Brooklyn alone, over 15,900 traffic-related injuries were reported in a single year, highlighting the borough's density and traffic volatility.
These figures underscore the critical reality that despite advancements in vehicle safety technology, human error, and infrastructure challenges continue to drive accident rates.
NYC vs. Long Island
As a firm deeply rooted in Long Island with a strong presence in the City, we see distinct differences in how accidents happen in these two regions.
| Area / Factor | Key Risk Characteristics | What Drivers & Pedestrians Should Know |
| New York City | High congestion, frequent intersections, mixed traffic (cars, cyclists, pedestrians) | Most crashes occur at low-to-moderate speeds but involve pedestrians or cyclists. Intersections are the highest-risk zones. |
| Long Island | Higher speeds, wide roads, parkways and rural stretches | Accidents tend to be more severe due to speed. Rear-end and high-impact crashes are more common. |
| Most Common Crash Type | Rear-end collisions | Often caused by distracted driving or following too closely, especially during rush hour. |
| Most Dangerous Crash Type | Side-impact (T-bone) collisions | Typically occur at intersections and are more likely to cause serious injury. |
| Highest-Risk Road Users | Cyclists and pedestrians | E-bikes and delivery traffic have significantly increased exposure and injury severity. |
| Top Contributing Factor | Distracted driving | Includes texting, GPS use, eating, and in-vehicle distractions—not just phone use. |
| Insurance Reality | No-Fault insurance system | Victims must meet the “serious injury” threshold to pursue pain and suffering claims. |
New York City: The Density Factor
In NYC, speed is often less of a factor than congestion. The high volume of pedestrians, cyclists, delivery trucks, and rideshare vehicles creates a "conflict-rich" environment.
- Queens: Often the deadliest borough, Queens recorded 78 traffic deaths in 2023. Its mix of highway-like boulevards and residential zones makes it particularly dangerous.
- Brooklyn: While Queens had the most deaths, Brooklyn had the highest volume of injuries and crashes overall, driven by intersections with poor visibility and high congestion.
- Manhattan: Despite the heavy foot traffic, Manhattan often sees lower fatality rates than the outer boroughs due to slower traffic speeds, though pedestrian injuries remain high.
Long Island: The Speed Factor
Nassau and Suffolk Counties present a different set of dangers. Here, the roads are wider, the distances greater, and the speeds significantly higher.
- Suffolk County: consistently ranks as one of the deadliest counties in the state for traffic accidents. The combination of rural backroads and high-speed arterials creates a deadly mix.
- Nassau County: High congestion on the Southern State Parkway and the LIE contributes to a massive volume of rear-end collisions and multi-vehicle pile-ups.
- Recent Trends: Long Island has seen a troubling rise in wrong-way driving incidents and alcohol-involved crashes in 2023 and 2024, prompting new safety studies by local officials.
Breaking Down the Data by Accident Type
1. Passenger Vehicle Accidents
The vast majority of collisions involve standard passenger cars.
- Rear-End Collisions: These remain the most common accident type, particularly on Long Island's parkways during rush hour.
- Side-Impact (T-Bone): These are statistically more dangerous and frequently occur at intersections in Queens and Brooklyn where drivers attempt to "beat the light."
2. Pedestrian Accidents
New York City is a walking city, but it is not always a safe one.
- The "Vision Zero" Struggle: While pedestrian deaths dropped by nearly 45% compared to a decade ago, 104 deaths in a single year is still 104 too many.
- High-Risk Groups: Seniors and school-age children remain the most vulnerable demographics for pedestrian accidents.
- Location: The majority of these accidents occur in crosswalks where the pedestrian has the right of way, usually involving a vehicle turning left or right.
3. Cyclist and E-Bike Accidents
The rise of e-bikes, scooters, and Citi Bikes has transformed New York's transit landscape, but safety laws haven't always kept pace.
- A Record High: The 29 cyclist deaths in 2023 represent a significant step backward.
- E-Bike Complexity: The speed of e-bikes often leads to more severe injuries than traditional bicycles. Legal liability can also be complicated, as some e-bikes fall into gray areas regarding insurance coverage.
4. Truck and Commercial Vehicle Accidents
With the boom in e-commerce, delivery trucks are everywhere.
- The "Amazon Effect": The pressure for rapid delivery has filled residential streets with vans and box trucks. These drivers are often under immense time pressure, leading to double parking, sudden stops, and blind-spot accidents.
- Severity: Accidents involving large commercial trucks on the LIE or BQE are statistically the most likely to result in catastrophic injury or death due to the sheer weight differential.
Top Contributing Factors to NY Accidents
Understanding why accidents happen is crucial for establishing negligence in a personal injury case. New York police reports consistently cite the following top factors:
1. Distracted Driving
This is the undisputed, number one cause of accidents in New York.
- The Stats: In 2023, "driver inattention/distraction" was cited in over 12,190 crashes in NYC alone.
- Beyond Texting: Distraction isn't just cell phones. It includes eating, adjusting GPS systems, dealing with passengers, and daydreaming.
2. Failure to Yield Right-of-Way
This is the leading cause of intersection accidents.
- The Scenario: A driver turning left at an intersection fails to see an oncoming car or a pedestrian in the crosswalk.
- The Stat: It caused nearly 4,700 crashes in NYC last year.
3. Following Too Closely (Tailgating)
This is the primary cause of rear-end accidents, especially on Long Island parkways where traffic stops suddenly.
- The Ripple Effect: One tailgating driver can cause a chain-reaction crash involving multiple vehicles.
4. Speeding
Unsafe speed is a major killer, particularly in Suffolk County and on the wide avenues of Queens.
- Force of Impact: Physics dictates that accident severity increases exponentially with speed. A crash at 50 mph is far more likely to be fatal than one at 30 mph.
High-Risk Locations: Areas of Caution
Based on accident data, certain roads require heightened vigilance.
In New York City:
- Atlantic Avenue (Brooklyn): A notoriously dangerous stretch for both pedestrians and vehicles.
- Queens Boulevard: Safety improvements have helped, but it remains a high-accident zone.
- The Cross Bronx Expressway: Frequent congestion leads to high accident rates, mostly property damage and minor injury, but frequent truck involvement adds risk.
On Long Island:
- Sunrise Highway (Route 27): High speeds, traffic lights, and commercial driveways make this one of LI's most dangerous roads.
- Southern State Parkway: Known for its winding curves and low overpasses, it sees a high volume of single-car accidents and rollovers.
- Route 25 (Jericho Turnpike): A mix of heavy commercial traffic and commuters leads to frequent intersection crashes.
The Human Cost: Injuries and Damages
Statistics often fail to capture the physical toll. We see the reality behind the numbers.
Common Injuries
- Traumatic Brain Injuries (TBI): Even a "minor" concussion from a car accident can have long-lasting cognitive effects.
- Spinal Cord Injuries: Herniated discs and whiplash are common even in low-speed rear-end collisions.
- Fractures: Pedestrians and cyclists frequently suffer leg and hip fractures upon impact with vehicle bumpers.
The Economic Impact
The cost of an accident goes far beyond vehicle repairs.
- Medical Bills: Emergency room visits, surgeries, and physical therapy can cost tens of thousands of dollars.
- Lost Wages: Recovery time often means time away from work, threatening a family's financial stability.
- Pain and Suffering: The emotional trauma and loss of enjoyment of life are real damages that may deserve compensation.
What These Stats Mean for You
New York is a "No-Fault" insurance state. This is a concept many drivers misunderstand.
What is No-Fault?
Regardless of who caused the accident, your own insurance (specifically the Personal Injury Protection or PIP coverage) pays for your initial medical bills and lost wages, up to a limit (usually $50,000).
When Can You Sue?
Because of No-Fault laws, you cannot sue the other driver for minor injuries. You can only pursue a personal injury lawsuit if you step outside the No-Fault system by sustaining a "serious injury" as defined by New York Insurance Law § 5102(d). This includes:
- Fractures.
- Significant disfigurement.
- Permanent limitation of use of a body organ or member.
- Significant limitation of use of a body function or system.
- Death.
Given the statistics we've shared, many New Yorkers do qualify to file a lawsuit, but they often don't realize it until they speak with an attorney.
The Importance of Investigation
With distracted driving being the top cause of accidents, proving negligence often requires a thorough approach.
- Cell Phone Records: We can subpoena phone records to prove a driver was texting at the time of the crash.
- Black Box Data: Modern cars and trucks have Event Data Recorders (EDRs) that track speed and braking seconds before impact.
- Camera Footage: In NYC and Long Island, red-light cameras, dashcams, and surveillance footage are vital pieces of evidence.
Why Local Experience Matters
When dealing with accidents in New York, geography matters. Rosenberg & Gluck, LLP has been serving Long Island and the Greater New York area for many years.
- We know the courts: A case in Suffolk Supreme Court is handled differently than one in Queens or the Bronx. We know the local procedures and judges.
- We know the roads: We know the traffic patterns, the blind spots, and the history of locations across the state.
Our Recent Results
While past results don't guarantee future outcomes, our firm has recovered millions for clients injured in:
- High-speed highway collisions.
- Pedestrian knock-downs in crosswalks.
- Multi-vehicle truck accidents.
Stay Safe, Stay Informed
The 2023-2024 accident statistics for New York serve as a sobering reminder that safety can never be taken for granted. Whether you are commuting from Suffolk County to Manhattan, delivering packages in Brooklyn, or simply walking your dog in Nassau, the risk is real.
We hope this data encourages you to drive a little more defensively, put the phone down, and watch out for your fellow New Yorkers. However, if the unthinkable happens, you do not have to face it alone. If you or a loved one has been injured in a motor vehicle accident in New York City or on Long Island:
- Seek Medical Attention Immediately: Your health is priority one, and medical records are crucial evidence.
- Do Not Admit Fault: Exchange information, but let the investigators determine the cause.
- Contact Rosenberg & Gluck, LLP: Before you speak to an insurance adjuster who may try to minimize your claim, speak to us.
Call us today at (631) 451-7900 or contact us online for a free consultation.